

P&L Dashboards
Gain Complete Financial Visibility with Intelligent Profit & Loss Analytics
Make Faster Financial Decisions with Real-Time P&L Dashboards
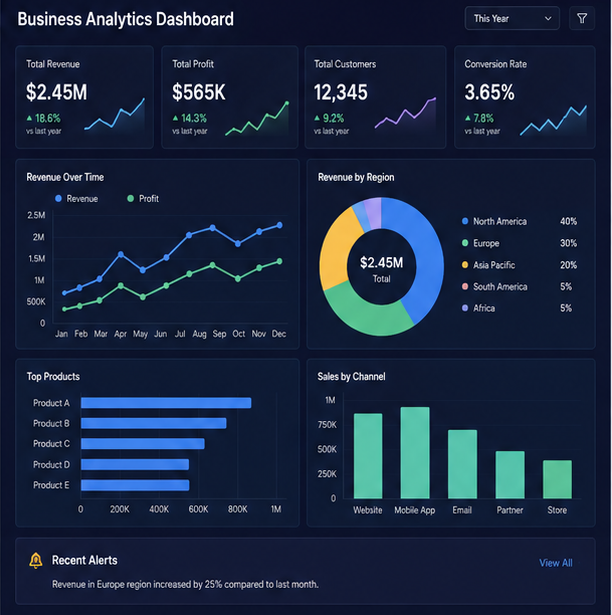
Gain complete control over your organization's financial performance with AI-powered Profit & Loss (P&L) Dashboards. PI Systems helps businesses build interactive, real-time financial dashboards that consolidate revenue, expenses, gross profit, operating margins, and profitability metrics into a single view. Powered by Microsoft Dynamics 365, Power BI, Microsoft Fabric, and AI-driven analytics, our P&L Dashboards empower finance teams and executives to monitor financial health, identify trends, and make confident business decisions.

What are P&L Dashboards?
P&L Dashboards are interactive financial reporting solutions that provide a real-time view of an organization's income, expenses, profitability, and overall financial performance. By integrating data from Microsoft Dynamics 365 Business Central, ERP systems, accounting platforms, and business applications, organizations gain instant visibility into key financial indicators and operational performance.
PI Systems helps businesses implement intelligent P&L Dashboards that enable finance teams, business leaders, and executives to analyze profitability, monitor financial trends, and drive strategic growth through data-driven decision-making.

Key Benefits
Monitor revenue, expenses, gross profit, operating profit, and net profit with live financial dashboards.
Leverage Microsoft AI and predictive analytics to identify financial trends, forecast profitability, and detect potential risks.
Empower executives and finance teams with accurate, real-time financial data for confident business decisions.
Connect seamlessly with Microsoft Dynamics 365 Business Central, Microsoft 365, Teams, Power BI, Azure, Power Platform, Microsoft Project, and Primavera.
Why Choose PI Systems for P&L Dashboards?
Unified Financial Visibility
Consolidate financial data from multiple business systems into one centralized dashboard for complete profit and loss analysis.
Deliver interactive financial reports, KPI scorecards, and profitability dashboards for leadership and stakeholders.
Reduce manual spreadsheet reporting through automated dashboards that provide accurate, real-time financial insights.
Build scalable financial reporting solutions powered by Microsoft's secure cloud platform, AI capabilities, and modern analytics technologies.
About P&L Dashboard
P&L Dashboard Capabilities
Track revenue performance across business units, products, customers, regions, and time periods.
Monitor operational expenses, departmental costs, overheads, and spending patterns to improve financial control.
Analyze gross margins, operating income, EBITDA, and net profitability through interactive visual dashboards.
Compare planned budgets against actual financial performance to identify variances and improve forecasting accuracy.
Evaluate profitability by department, branch, project, business unit, or cost center to support better resource allocation.
Identify financial trends, seasonal patterns, and performance variances using AI-powered analytics and historical comparisons.
Utilize Microsoft AI and Copilot to predict revenue, expenses, cash flow, and future profitability with greater accuracy.
Access secure P&L reports and financial dashboards from desktop, tablet, or mobile devices anytime, anywhere.
Enable finance professionals and business users to explore financial data, generate reports, and analyze profitability without relying on IT teams.
